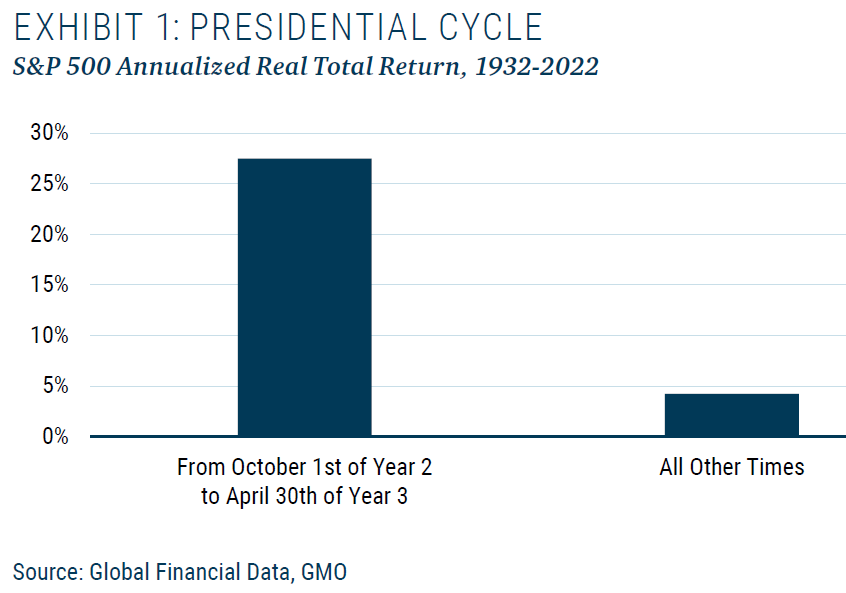
Sometimes the simplest explanations get overlooked. Is it possible the recent rally in the stock market that started last year is a by-product of the repeating Presidential Cycle? The chart below shows that for 7 months of the presidential Cycle, from October 1st of the second year (this cycle, 2022) through April 30th of the third year (2023), the returns in the stock market, since 1932, equal the returns from the remaining 41 months of the presidential cycle! According to the research team at GMO, this has a less than one-in-a-million probability of occurring by chance, pretty remarkable!
The premise is simple, politicians want to get re-elected so they pump the economy with stimulus to help their reelection bid. In order to get our complex economy humming around election time they need to stimulate the economy around 12 to 18 months before the actual election. Which matches up with the big returns generated during the 7-month Presidential Cycle highlighted below. Could it really be that simple? Probably not, but the numbers are convincing.